Drawing Graphs and Diagrams with Atom and Viz.js
The other day I was tasked with creating some architecture diagrams and process flow charts. Usually I would prepare these in Visio like the rest of the world, but I wanted to try something new. I’ve been reading about Atom, the MIT-licensed ‘hackable text editor for the 21st Century’ developed by GitHub, and how extensible and productive it is, so I decided to dig in and see if any of the popular Javascript libraries (like Viz.js and mermaid) for bringing text-based diagrams to life could be integrated into it.
In this post I will cover how to install the Markdown Preview Enhanced package for Atom, a few of its features, and how to use it to generate graphs and diagrams using the Viz.js integration.
Installation #
If you do not have Atom already, you can download it here for macOS, Linux, and Windows.
Once you have Atom installed and open, go to the Preferences or Settings (depending on platform; I am writing this now on macOS, and it’s called Preferences; on Windows, it’s Settings). Head to + Install, type markdown-preview-enhanced in the search field, and press Enter. When it pops up, hit the Install button. It will take a few minutes to install.
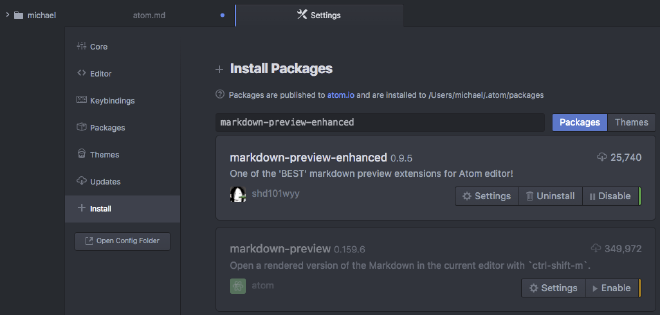
Optionally, you can disable the built-in Markdown preview package. I did this so I could use its Ctrl+Shift+M keyboard shortcut. You can also switch around the keybindings if you want to keep them both active.
Using markdown-preview-enhanced’s basic features #
Create a new document in Atom and save it with the .md extension. Saving the file is required to activate the extension.
Now you can type Markdown and preview it using Ctrl+Shift+M. You can also activate the preview by right-clicking inside your document and selecting the Toggle markdown-preview-enhanced option, or from the Packages menu on the toolbar.
If you’re familiar with Markdown, know that markdown-preview-enhanced uses the remarkable engine with the CommonMark syntax.

Drawing graphs and diagrams #
To start drawing graphs, you create Markdown code block calling out the Viz.js integration like this.
```{viz}

   [...]

```
Anything inside this code block will be interpreted by Viz.js according to the DOT graph description language. DOT has a lot of features and I won’t be covering them all here, but we will get started drawing directed graphs (i.e, a graph with nodes which are connected with edges in a certain direction).
To get started with a directed graph, first specify the rendering engine. The only engine that concerns us in this post is dot, specified by engine: dot as the first line of your code block. Then, we can specify we’re building a directed graph with digraph G and a set of curly braces. Finally, we can indicate the desired size of the graph in inches. For example, 6 inches by 6 inches, as shown here. This is what your code block looks like now:
```{viz}
engine: dot
digraph G {
  size="6,6"

}
```
For an example, let’s create the Tech Support Cheat Sheet from xkcd.
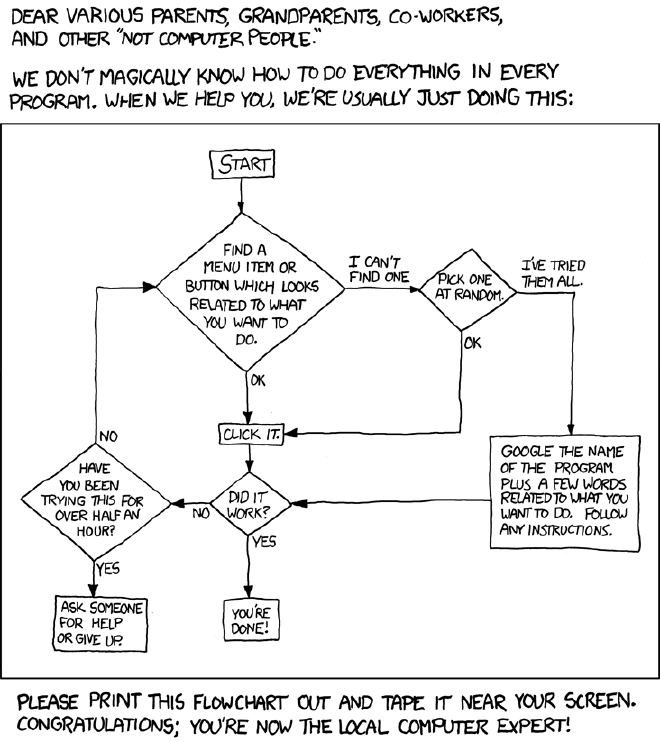
Start by identifying your nodes. The basic syntax here is node_name [label="node label", shape=node_shape]. Some common shapes are box, circle, ellipse, and diamond. The node_label is the text you will see in the node shape. You can use \n inside the node_label for a newline.
```{viz}
engine: dot
digraph G {
  size="6,6"

  start [label="START", shape=box]
  relevant_p [label="FIND A\nMENU ITEM OR\nBUTTON WHICH LOOKS\nRELATED TO WHAT\nYOU WANT TO\nDO.", shape=diamond]
  click_it [label="CLICK IT.", shape=box]
  work_p [label="DID IT\nWORK?"]
  how_long [label="HAVE\nYOU BEEN\nTRYING THIS FOR\nOVER HALF AN\nHOUR?", shape=diamond]
  ask [label="ASK SOMEONE\nFOR HELP\nOR GIVE UP.", shape=box]
  done [label="YOU'RE\nDONE", shape=box]
  pick_random [label="PICK ONE\nAT RANDOM", shape=diamond]
  google [label="GOOGLE THE NAME\nOF THE PROGRAM\nPLUS A FEW WORDS\nRELATED TO WHAT YOU\nWANT TO DO. FOLLOW\nANY INSTRUCTIONS.", shape=box]
}
```
Now you can connect your nodes. The syntax here is start_node -> end_node. If you want to label the arrow between nodes, you can label them similarly to nodes: start_node -> end_node [label="ARROW LABEL"]. I’ve found the graphs come out best when you put your arrows left to right, top to bottom, and mark arrows that don’t meet that with [..., dir=back]. Here’s what that looks like:
```{viz}
engine: dot
digraph G {
  [...]

  start -> relevant_p
  relevant_p -> click_it [label="OK"]
  click_it -> work_p
  work_p -> done [label="YES"]
  relevant_p -> how_long [dir=back, label="NO"]
  relevant_p -> pick_random [label="I CAN'T\nFIND ONE."]
  how_long -> ask [label="YES"]
  how_long -> work_p [dir=back, label="NO"]
  work_p -> google [dir=back]
  click_it -> pick_random [dir=back, label="OK"]
  pick_random -> google [label="I'VE TRIED\nTHEM ALL."]
}
```
Go ahead and Ctrl+Shift+M and see how it looks.
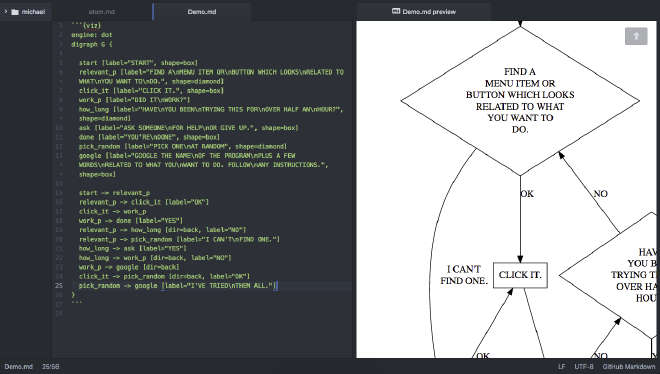
Well, that’s not quite right, is it?
There are two more features of DOT I’m going to cover.
The first is how to say that certain nodes should be at the same rank. That is, showing them at the same level. The syntax to put nodes at the same rank is: {rank = same; node1, node2, ... noden }. Adding these looks like this:
```{viz}
engine: dot
digraph G {
  [...]

  { rank = same; relevant_p, pick_random}
  { rank = same; how_long, work_p, google }
  { rank = same; ask, done }

}
```
We also want to control where the arrows leave and hit the nodes. We use ports for this. On each arrow, you can add headport and tailport attributes, with values of n,ne,e,se,s,sw,w,nw (like a compass).
Adding the relevant ports to our arrows, we get the following:
```{viz}
engine: dot
digraph G {
  [...]

  start -> relevant_p
  relevant_p -> click_it [label="OK", headport=n, tailport=s]
  click_it -> work_p
  work_p -> done [label="YES"]
  relevant_p -> how_long [dir=back, label="NO", headport=n, tailport=w]
  relevant_p -> pick_random [label="I CAN'T\nFIND ONE."]
  how_long -> ask [label="YES"]
  how_long -> work_p [dir=back, label="NO"]
  work_p -> google [dir=back]
  click_it -> pick_random [dir=back, label="OK", headport=s, tailport=e]
  pick_random -> google [label="I'VE TRIED\nTHEM ALL.", tailport=e, headport=n]
}
```
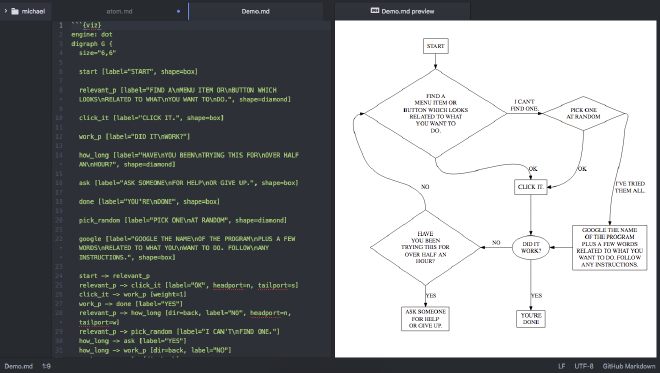
Putting everything together, here’s our completed DOT graph:
```{viz}
engine: dot
digraph G {
  size="6,6"

  start [label="START", shape=box]

  relevant_p [label="FIND A\nMENU ITEM OR\nBUTTON WHICH LOOKS\nRELATED TO WHAT\nYOU WANT TO\nDO.", shape=diamond]

  click_it [label="CLICK IT.", shape=box]

  work_p [label="DID IT\nWORK?"]

  how_long [label="HAVE\nYOU BEEN\nTRYING THIS FOR\nOVER HALF AN\nHOUR?", shape=diamond]

  ask [label="ASK SOMEONE\nFOR HELP\nOR GIVE UP.", shape=box]

  done [label="YOU'RE\nDONE", shape=box]

  pick_random [label="PICK ONE\nAT RANDOM", shape=diamond]

  google [label="GOOGLE THE NAME\nOF THE PROGRAM\nPLUS A FEW WORDS\nRELATED TO WHAT YOU\nWANT TO DO. FOLLOW\nANY INSTRUCTIONS.", shape=box]

  start -> relevant_p
  relevant_p -> click_it [label="OK", headport=n, tailport=s]
  click_it -> work_p
  work_p -> done [label="YES"]
  relevant_p -> how_long [dir=back, label="NO", headport=n, tailport=w]
  relevant_p -> pick_random [label="I CAN'T\nFIND ONE."]
  how_long -> ask [label="YES"]
  how_long -> work_p [dir=back, label="NO"]
  work_p -> google [dir=back]
  click_it -> pick_random [dir=back, label="OK", headport=s, tailport=e]
  pick_random -> google [label="I'VE TRIED\nTHEM ALL.", tailport=e, headport=n]

  { rank = same; relevant_p, pick_random}
  { rank = same; how_long, work_p, google }
  { rank = same; ask, done }

}
```
Now our graph looks like this:
Exporting your document preview #
If you right click inside your preview pane, you will see a few options. The two I want to draw your attention to are Open in Browser and Export to Disk.
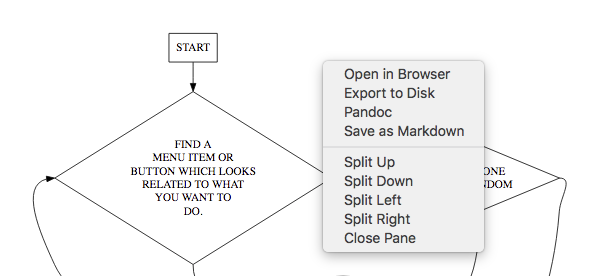
If you click Open in Browser, Atom will present this preview for you in your default browser. I use this a lot when working with these graphs for a less claustrophobic experience.
Export to Disk will give you the option to export your preview as an HTML file or a PDF.
Retrospective #
Not every experiment is entirely successful. I wanted to square off the arrows between nodes. You can do this with DOT, but then specifying headports and tailports does not work as expected. This is a known deficiency.
I still think GraphViz is a very useful tool for graph visualization. Duplicating an existing graph aside, it’s very nice to be able to generate these visuals just by typing. It fits my workflow more than dragging and dropping, and the end result is a great starting point to a more polished final product made in Visio.
The other draw to GraphViz is scalability. Creating the XKCD flowchart in Visio would have been pretty quick. However, having a textual description of a graph allows them to be generated programmatically very easily. You could use the DOT language to build a graph of hundreds or thousands of data points, and it would be a lot easier than moving nodes around by hand. I’ll post about this in the future!